The last few decades have witnessed numerous initiatives aimed at finding an accurate method for quantifying and comparing the efforts dedicated by different countries to their environmental policies and the actions undertaken to mitigate their environmental impact. Of all the methods proposed, the Environmental Performance Index (EPI) has achieved the most consensus and has been adopted by the largest number of universities and public institutions.
The EPI is a method that allows the environmental performance of a country to be calculated on the basis of its environmental policies. It was developed by Yale University (USA) and has been published every two years since 1999 (although it was calculated slightly differently in the period 1999 to 2005 and was known as the Environmental Sustainability Index (ESI)). More and more countries have gradually been added, and in the last edition of the report, published in 2014, data for 178 countries were presented.
The EPI is obtained by calculation and weighted aggregation of 20 indicators reflecting national-level environmental data. These indicators are combined into nine issue categories, each of which fit under one of two major objectives: environmental health, which measures the protection of human health from environmental harm, and ecosystem vitality, which measures ecosystem protection and natural resource management. The first objective includes three indicator categories: (1) the impact of the environment on health, (2) the effects of air quality on health, and (3) drinking water and sanitation. The objective that analyses ecosystem vitality includes six indicator categories: (1) water resources, (2) agricultural resources, (3) forestry resources, (4) fishing resources, (5) biodiversity and habitat, and, finally, (6) climate change. This battery of 20 indicators provides a representative image of the different environmental aspects for each country.
The calculations begin with transformation of the raw data into standardized, comparable performance indicators on the basis of population data, industrial output, etc. A technique known as “proximity-to-target”, which assesses how close a particular country is to an identified policy target, is then used to calculate the EPI indicators. The targets are determined beforehand on the basis of national or international policies or established and commonly accepted scientific thresholds. The indicators are then assigned a score of between 0 and 100, with 0 being the farthest from the target and 100 being closest to the target.
Quantification of the indicators has a dual purpose: firstly, it allows the various countries to be compared and a ranking of countries based on selected environmental aspects to be drawn up. Secondly, the indicators allow the evolution of any country over the past few years to be determined with respect to a specific indicator.
Consequently, once the EPIs for 2014 have been calculated, it becomes possible to answer questions of the type: which is the most contaminating country? Which industrialized country is most environmentally sustainable? Which Latin American country has improved most in environmental terms over the past 10 years? Several results obtained upon calculation and subsequent analysis of the indicators can be found below:
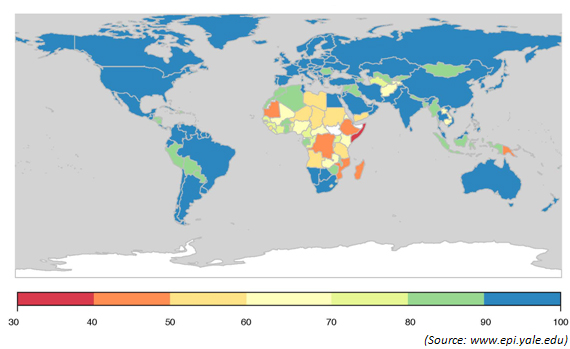
1. Graph showing access to clean drinking water
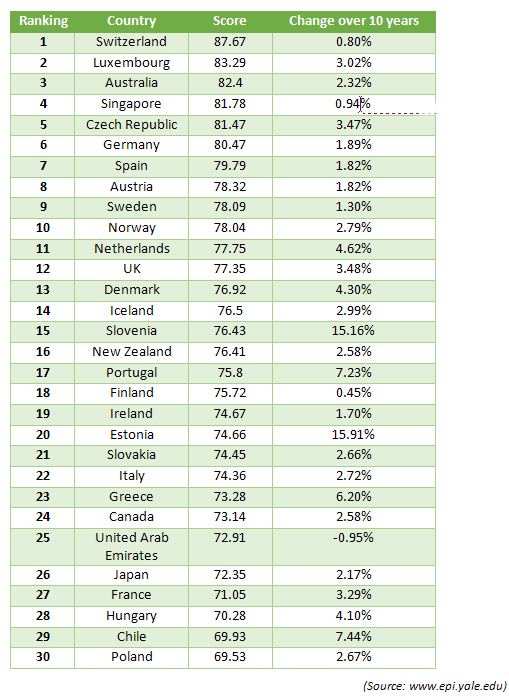
2. Ranking of the 30 most environmentally sustainable countries
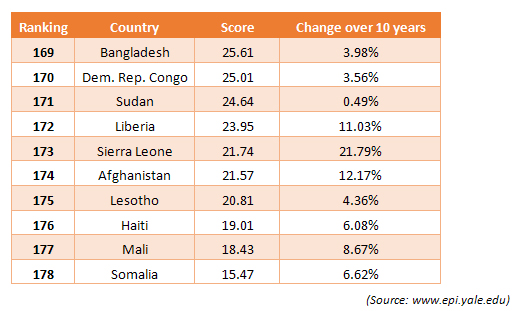
3. Ranking of the 10 least environmentally respectful countries
Consequently, the EPI is an excellent tool that allows the situation of a country to be analyzed and compared on the basis of the actions taken to comply with its established environmental objectives. This calculation method has been validated by numerous researchers from various universities and public institutions. However, it should be noted that some environmental aspects are still not taken into account when calculating the indicators. This is the case, for example, for fresh water quality, municipal solid waste management, nuclear safety, wetland loss, recycling percentages for the different types of waste, and adaptation and vulnerability to climate change, amongst others. However, although this information is not included, the image resulting from the battery of environmental indicators included in the EPI remains highly representative of a country’s environmental status.
